![]()
| Main index | Financial Markets index | About author |
![]()
Julian D. A. Wiseman
Abstract: when plotting yields of closely related securities, the natural x axis to use is tenure, defined to be Macaulay-Weil convexity ÷ Macaulay-Weil duration.
Publication history: only here. Usual disclaimer and copyright terms apply.
So yields of government bonds or similar securities are to be plotted. Against what x axis should they be plotted? Well, what properties should be desired? The natural desideratum is that the output is a function, in that each point on the x axis should have a unique yield, or nearly so. Then any deviations from uniqueness represent a possible trade, high points being cheaper securities; and lower, dearer. This means that there is no need for post-plotting in-head adjustments for a high or low coupon. So this essay proceeds by comparing, for a particular perfectly priced very shapely yield curve, the par and zero-coupon curves, to identify the x axis that causes them to most nearly overlap.
This most-nearly-overlapping choice of x axis will prove to be convexity divided by duration, here defined to be tenure, and a theoretical justification for this formula is given.
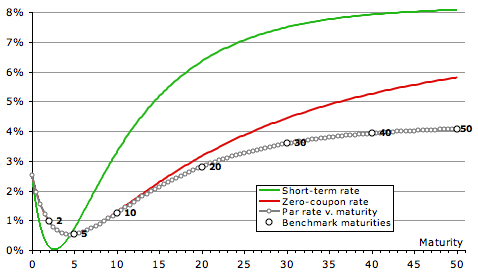
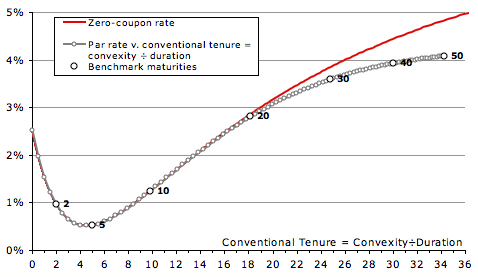
The chart on the shows the yield curve used throughout this essay. In green are the assumed instantaneous rates; if quoted continuously-compounded these equalling 8% – 13%×e–t/10 + 7½%×e–t/2, but being plotted semi-annual. This example curve is therefore very shapely: forward rates start near 2.50%, fall to almost 0%, and then rise to 8%. In red are the zero-coupon rates derived from these, also plotted semi-annual. From these are derived par rates for semi-annual bonds, assumed to have payments exactly half a year apart. These are shown in grey, except for the 2-, 5-, 10-, 20-, 30-, 40- and 50-years, which are shown larger in black, and labelled. (Though the US doesn’t have bonds longer than 30 years, the UK and France have each issued a 50-year.)
And, measured against the desideratum, plotting yields against maturity is terrible. The 30-year bond yields almost 85bp less than the same-maturity strip.
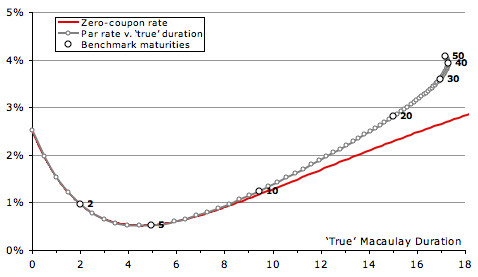
The second chart uses as its x axis ‘true’ duration, also known as Macaulay-Weil duration. It is the present-value-weighted average time for each security, where the present values are calculated using the zero-coupon curve (whether calculated from a model or from the prices of strips is unimportant). And Macaulay-Weil duration is about as bad as plotting against maturity, though in the opposite direction, the 30-year yielding 94bp more than the same-duration strip.
(Also note the odd feature: if the yield curve is sufficiently steep, longer par bonds can have a shorter Macaulay-Weil duration. This oddity can also occur with plain Macaulay duration, but requires a curve that is implausibly flat then steep.†)
The previous two tests have been resounding failures, so let’s try an observation, and then some theory.
Observation: consider a 10-year strippable security, making two payments, each of equal present value. In a few seconds the bond will pay 50 units of money, and in 10 years it will make a second payment, sufficiently large that the second payment now happens to have a present value of 50. In terms of the yields of the two strips, what is the yield of the bond? Of course, the yield of the about-to-pay strip is irrelevant: the yield equation will solve to the yield of the 10-year strip. Yet this security has a Macaulay(-Weil) duration of 5 years: thus duration must be the wrong axis to use.
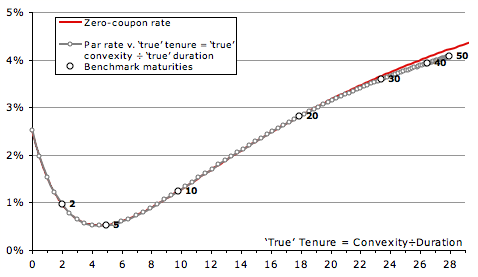
Theory: it is easy to see that the yield of a bond is close to the PV×time-weighted average of the yields of its cashflows.‡ And the chronological centre of these weights is at the PV×time-weighted average time, this being (∑ PVi ti²)÷∑ PVi ti = E(ti²)÷E(ti). This is the ratio of Macaulay-Weil convexity to Macaulay-Weil duration. Define this to be Macaulay-Weil tenure, or true tenure.
And behold the chart, with an x axis of true tenure, in which the zero-coupon curve lies very close to the par curve. For the thirty-year bond the error is less than 7bp, and even at fifty years the error is an edge less than 14bp. For those with a model that can discount individual cashflows, the best known x axis is Macaulay-Weil tenure.
But what if one doesn’t have access to a model that can value individual cashflows? What if calculations must be done one bond at a time?
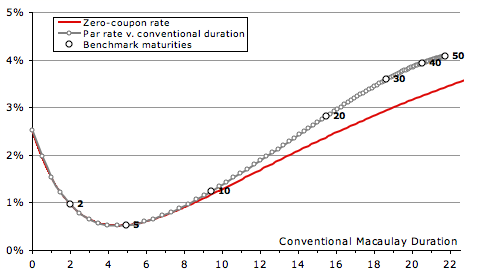
The chart on the right shows yields plotted against a conventional Macaulay duration, that is, one in which the PV of each cashflow is calculated using the yield of the security. Of course, this is manifestly illogical, as the same cashflow in different bonds can have different weights, but it is computable one bond a time. The chart is a reasonable approximation, great up to 10 years, and only slowly diverging thereafter, though manifestly not as close as having true tenure on the x axis.
Finally, the last of the candidate x axes, plain Macaulay tenure, being the ratio of Macaulay convexity to Macaulay duration. This is also a reasonable approximation, though also far worse than the true tenure axis.
It should not surprise that the two variants of tenure give very different outcomes. The true tenure discounts the 100 principal at the zero-coupon curve to 5.73; whereas the Macaulay tenure discounts at the bond’s yield, so to 13.30. That one weight is 2.32× the other, because the curve was assumed to be so steep, greatly affects the outcome.
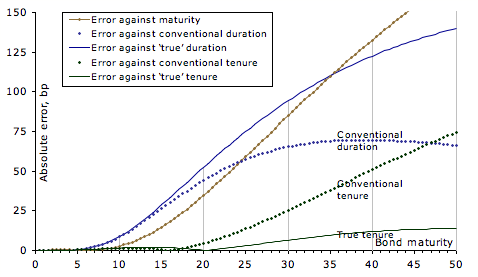
To simplify the comparison between the five possibilities, this penultimate large chart shows, for each of the above charts, the absolute value of the difference in yield between the bonds and the strips with the same x values. Very obviously the best x axis is true tenure, followed far behind by that which can be called conventional tenure, with conventional Macaulay duration in third place.
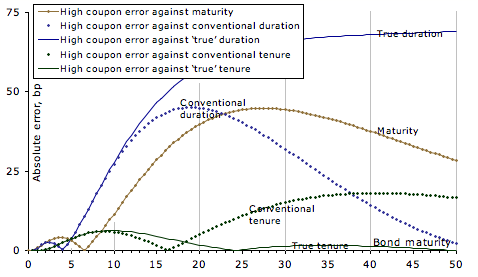
But what about high-coupon bonds? Choosing a coupon 5% above that of the same-maturity par bond, and comparing to the interpolated par bond with matching x value, leads to errors shown in the last chart. Again, true tenure is very accurate, the absolute error having local maxima of 6.3bp (at 10 years) and 1.3bp (at 34½ years). The second best x axis, conventional tenure, has a similar peak error near 10 years, but another peak error of 18bp (at 40½ years). Other x axes are manifestly worse.
And true tenure is not difficult to compute, whether using a smoothed yield curve model, or the prices of the individual cashflows in the strip market. Using an x axis of true tenure greatly improves the readability of yield charts, making far more obvious which securities are trading cheap and which dear.
— Julian D. A. Wiseman
New York, November 2008
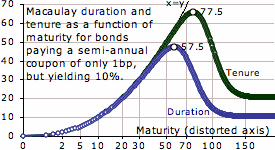
† E.g., consider a continuously-compounded instantaneous forward rate curve equalling 0.01%×et. Then the 8-year par bond, with a coupon of just over 3.366%, has a conventional Macaulay duration of 7.079 years, whereas the 10½-year par bond, with a coupon of just over 11.613%, has a smaller duration of 6.326 years. Duration can have other non-intuitive features. Assume the yield curve is flat at semi-annual 10%, and that the government is to issue a bond with a coupon of only 0.01%. Considering only maturities of an integer number of semi-annual coupon periods, how does Macaulay duration (true Macaulay-Weil equalling conventional Macaulay) vary with maturity? The 57½-year would have a duration of 47.393 years (the coupon is so small that the bond only marginally differs from a zero-coupon), whereas the infinite-maturity perpetual would have a duration of only 10.5 years (the duration of a perpetual being a coupon period plus reciprocal yield). So even with a flat yield curve, and a constant (albeit sub-yield) coupon, longer bonds can have a shorter duration. And in this example even the tenure peaks, for the 77½-year being 65.6899, for longer bonds tending down to 20.5 years (a coupon period plus twice reciprocal yield).
‡ Proof of the approximation to a bond’s yield. With all yields quoted continuously compounded, consider a flat curve, so yield of bond = yield of cashflows. For a cashflow paying an amount with present value PVi at time ti, nudge its yield ri by +ε. That changes its price, and hence the price of the bond, by –PVi ti ε. So the yield of the bond changes by PVi ti ε ÷ DV01bond. Therefore the yield of the bond is approximated by a weighted average of the yields of the cashflows, with weights proportional to PVi ti ⇒ the bond’s yield ≈ (∑ PVi ti yi)÷∑ PVi ti. Finally, distort and relabel the y axis to convert to the preferred quotation frequency, the doing of which will be independent of x value (for a consistent quotation convention).
| Main index | Top | About author |