![]()
| Main index | Other Papers index | About author |
![]()
Julian D. A. Wiseman
Contents: Introduction; Theory; China versus USA; Afterword.
Publication history: only here. Usual disclaimer and copyright terms apply.
Which country won the 2008 Olympics? Setting aside the unreported question of whether this should matter — participants are there to represent themselves rather than their country’s ambitions — the question entails comparing gold and silver and bronze medals. Is the USA’s 36:38:36 better or worse than China’s 51:21:28? (One could also compare medals per head of population, as does the BBC story entitled Five alternative Olympics medals tables, but this essay tackles the simpler task of comparing medal totals.) Unsurprisingly, the American press seems to prefer total medal count (USA wins 110 to 100), whereas Chinese interest and commentary, even before the games began, was just the golds (Sacked coach attacks China 'medal lust', 18 July 2008: “China is desperate to top the gold medal table at this summer's Olympics”).
So we start with some theory on ordering sets of G:S:B, and then discuss the actual 2008 numbers.
Though there are a continuum of weighting schemes, there are six extreme cases of interest. If country A beats country B in any five of the six, then it definitely wins in the sixth and in any weighting scheme satisfing g > s > b > 0.
The next table summarises these six ways of sorting the medal table.
| Sort Order | I | II | III | IV | V | VI |
|---|---|---|---|---|---|---|
| First | G | G | G+S | G+S | G+S+B | G+S+B |
| Second | S | S+B | B | G | G | G+S |
| Third | B | S | G | B | S | G |
To show that these six are not equivalent, consider three countries, P, Q and R, with medals P = 1:0:1; Q = 0:2:0; and R = 0:1:2. These six extremal scoring methods each give a different ordering on the countries: I ⇒ PQR, II ⇒ PRQ, III ⇒ QRP, IV ⇒ QPR, V ⇒ RPQ, VI ⇒ RQP.
It might be easier to think of sorting the countries by a score: so many points for each of the three medal types. These six methods can be replicated using weights as in the next table, in which n > the largest number of medals won by any one country. Reading and understanding the table is simplified by imagining that n = 1000.
| Numerical Weights | I | II | III | IV | V | VI |
|---|---|---|---|---|---|---|
| Gold | n² | n² | n²+1 | n²+n | n²+n | n²+n+1 |
| Silver | n | n+1 | n² | n² | n²+1 | n²+n |
| Bronze | 1 | n | n | 1 | n² | n² |
(This table is equivalent to one generated by assigning 1, n and n², in each of the six possible orders, to b, s–b and g–s.)
Though these six methods are not the same, they are not fully independent. If, for example, country M beats country N under I and III, then M also wins under method IV. These relationships, and examples thereof, are in the next table. (Please send any omitted relationships to the author.)
| These | Imply These | Winner of ‘These’ and ‘These’, Loser of others G:S:B | Loser of ‘These’ and ‘These’, Winner of others G:S:B |
|---|---|---|---|
| I and III | IV | 0:1:0 | 0:0:2 |
| I and V | II | 1:0:1 | 0:2:0 |
| II and IV | I | 1:0:0 | 0:1:1 |
| II and VI | V | 0:0:2 | 0:1:0 |
| III and V | VI | 0:1:1 | 1:0:0 |
| IV and VI | III | 0:2:0 | 1:0:1 |
| I and VI | II and V | 1:0:2 | 0:2:0 |
| II and III | I and IV | 1:0:0 | 0:0:2 |
| IV and V | III and VI | 0:2:0 | 1:0:0 |
| (I or II) and (III or IV) and (V or VI) | All | 0:0:1 | 0:0:0 |
These weightings are the corner cases: if M beats N under none of them, there is no sensible weighting scheme under which M beats N. But that is only pairwise competition. Consider X = 2:0:0; Y = 1:0:4; and Z = 0:0:6. Under I, II, III and IV the ordering is X beats Y beats Z. Under V and VI it is the reverse: Z beats Y beats X. So Y can beat X, and Y can beat Z, but in the six corner weightings Y is always second. But if a gold is given 3 points, a silver 2, and a bronze 1, then Y wins with 7 points, against 6 for each of X and Z. (Y wins if 4b > g > 2b > 0.) Hence these corner weightings determine which countries can be beaten one-on-one, not which combinations of countries can simultaneously be beaten.
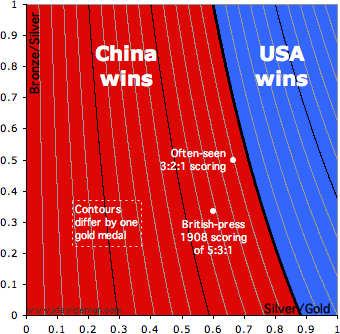
So now we come to the controversy. China’s G is bigger, so China wins under I and II. The USA’s G+S is bigger, so it wins under III and IV. And the USA’s G+S+B is bigger, so it wins under V and VI. Either could reasonably be called the winner.
But it would be excessively cowardly to fail to make a decision: China won, for two reasons.
Before the Olympics started, golds were the standard being predicted, and to which importance was assigned. Hence, the results known, that is the standard that should be used.
Assign gold a score of 1. Then consider all S/G ratios from 0 to 1, and all B/S ratios from 0 to 1. The chart on the right shows which give a victory to China, and which a victory to the USA. Of the area of the chart Ln(25/17)×15/8 ≈ 72.3% is Chinese†. That’s a lot.
Finaly, a mischievous suggestion. This author cannot be the only person to value a medal in the 1500 metres more highly than one in synchronised swimming. So multiply each medal by the number of Olympics in which that event has been competed. This would devalue new events — if you do the work to gather the data, please tell the author.
Julian D. A. Wiseman, August 2008
† This suggests a mathematical puzzle: is it possible for three countries to have integer numbers of golds, silvers and bronzes such that each of the six possible rankings happens in exactly one sixth of the area?— a question discussed in greater detail in Open Mathematical Questions at jdawiseman.com. It is certainly possible to get close: each country can be a winner in one third the area with 4:0:0, 2:6:0 and 0:9:0. Further, each of the six rankings has the correct area with 1:0:½(y+z), 0:x+½(y–z):z and 0:x:y, where z = 0, x = (1/(e^(y/12)-1) - 1)×y/4, and y satisfies 1 = (-4 + y/(e^(y/12)-1) - 4×Ln(y/4/(e^(y/12)-1)) ) × 3/y, so y ≈ 5.818231244749 and x ≈ 0.87670481149; thus being approximately 1:0:2.909115622374, 0:3.785820433865:0 and 0:0.87670481149:5.818231244749. (Spreadsheet available on request.)
14th August 2016: Upon reflection, the area test was silly. Consider three countries, the first having 3 golds, the second 7 silvers, and the third 15 bronzes. Then the area test does not reveal a Condorcet winner. The second beats the first over 4/7 ≈ 57% of the area. The third beats the second over 8/15 = 53⅓% of the area. And the first beats the third over (1+Ln[5])/5 ≈ 52% of the area.
Which suggests a simple puzzle: what’s the largest area such that A can beat B over that at least that area; B beats C ditto; and C beats A ditto? The answer might have medals increasing geometrically with factor ≈2.1743547824723, so each wins with ≈54.00934529815% of the area.
So what’s the minimum area by which A must beat B to be sure that there is no C beaten by B and beating A? Might the answer be (1+Ln[4])/4 ≈ 59.657359%? Counter-example welcomed.
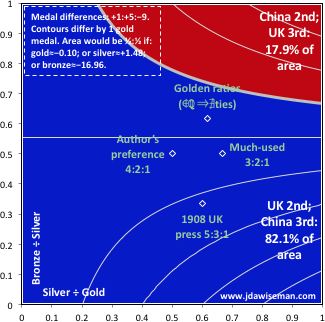
22nd August 2016: The 2016 Rio Olympics was won by the USA. Second place was closer, the UK finishing ahead of China by 1 gold and 5 silvers, but behind by 9 bronzes. The chart shows that the UK, with (3+Ln[2])×2÷9 ≈ 82% of the area, can claim the overall silver.
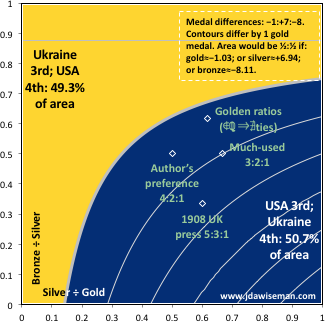
19th September 2016: The 2016 Rio Paralympics was won by the China, crushingly. Then the UK, by a country mile. But fourth place was very close, the USA finishing behind Ukraine by 1 gold and 8 bronzes, but ahead by 7 silvers. The chart shows that the USA has (6-Ln[7])÷8 ≈ 50.676% of the area. That’s close. But the USA has more of the area, and all four of the conventional ratios, so beats Ukraine.
| Main index | Top | About author |