| Main index | Financial Markets index | About author |
Julian D. A. Wiseman
Abstract: should governments borrow by re-opening old securities, or by issuing new securities? To a far greater extent than they do, they should re-open.
Contents: Introduction; Cashflow dispersion; Charts; Liquidity; Summary; How well have they been doing? United Kingdom Debt Management Office, United States Treasury, Japan, Agence France Trésor and the German Finance Agency; Afterword.
Publication history: only here. Usual disclaimer and copyright terms apply.
A government debt manager wishes to sell a bond with approximately 30 years remaining life, and there is already a circa 29-year bond. Should the government create a new 30-year or re-open the 29-year? Or the government wishes to issue a bond with about five years to maturity, and there are already other bonds with similar maturity: new security, or a re-opening?
When deciding between a new and re-opening of an existing bond, three factors should be considered.
Governments should want their debt cashflows to be dispersed over time. If there were only one bond maturity every half decade, government finances would be pushed into cycles of relative plenty followed by severe dearth. Indeed, such payment lumpiness might even interact with the electoral cycle, and probably not in a manner conducive to good policy. But this desideratum bites only for short-dated paper: bonds about to mature need to be evenly spaced. Longer-dated bonds do not need such evenness, as any uneven spacing can be ‘fixed’ later, either by judicious choice of maturity of new issues (if the government is in deficit), or by buying back out-sized bonds (if in surplus) or both (if the budget is nearly balanced).
So short-dated bonds, say those with less than a decade to run, should ideally have an even pattern of maturities, with a similar quantity redeeming in each fiscal year.
If some investors have, say, 30-year liabilities, and the longest bond is currently 15 years, then one would expect investors to be willing to pay a good price for an asset that would offset this 30-year liability. Likewise, if there were 5-year and 30-year bonds, but none between, investors with liabilities between should be willing to pay a good price for 10- or 20-year bonds.
But careful qualification is appropriate. Imagine that there are already 20- and 30-year bonds outstanding. Investors might still have a need for a 25-year bond if, and only if, such a security could not be replicated with some combination of the existing 20- and 30-year bonds. If the 25-year could be accurately replicated with the 20s and 30s, then investors with 25ish year liabilities should not be expected to pay a premium for a 25-year bond.
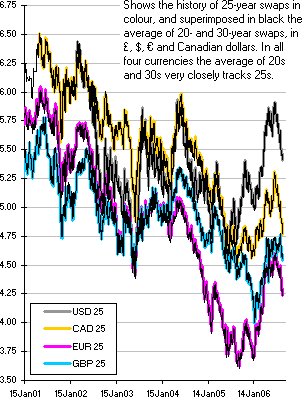
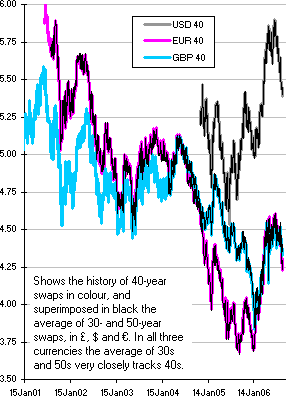
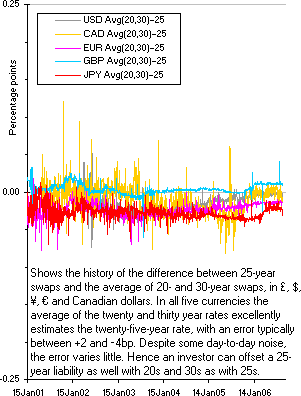
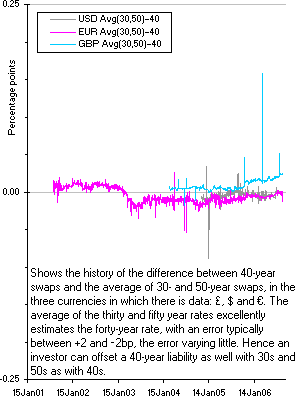
The following charts show that the 25-year swap rate very closely tracks the average of the 20- and 30-year swap rates in £, $, €, ¥, and CAD; and that the 40-year rate is even closer to the average of the 30- and 50-year rates (in the few currencies for which there is 50-year data). Observe that these charts compare the central rate to the equally weighted average of the wings: a more complicated weighting scheme would give an even closer replication. Hence governments ‘completing markets’ by issuing bonds that could not otherwise be replicated does not require a dense set of bonds on the curve: beyond two decades 20-, 30-, 50- and perhaps a 75-year would be sufficient, bonds between these being redundant.
| Thick colour: history of 25-year swaps Thin black: average of 20- and 30-year swap rates  |
Thick colour: history of 40-year swaps Thin black: average of 30- and 50-year swap rates  |
Average(20,30) – 25-year swap rates |
Average(30,50) – 40-year swap rates |
So a pension fund could very closely replicate a 40-year liability with a combination of 30- and 50-year assets. But pension funds don’t even have known 40-year liabilities: they have future payments estimated using life-expectancy tables derived from assumptions about medical technology that will turn out to be wrong. Though the absolute amount of risk in a 30s/40s/50s barbell is only a few basis points, the risk relative to that caused by the error in the estimated liabilities is miniscule.
Let us assume that long-term investors turn over their portfolio once every two years. Under this assumption, there is a clear relationship between yield and dealing costs.
Consider two securities, one of which has a bid-ask spread of 20¢, and one of which has a bid-ask spread of 10¢. So dealing costs an investor in the first an extra 5¢ per annum, which would be worth paying only if the bond yields 5bp more. Hence reducing bid-ask spreads should reduce yields, and would hence be worthwhile for a debt manager.
Now consider the position of a market maker, asked to make a price in 100 million of some security. If the market-maker thinks that, in the next half hour, other investors will ask for a price in the same bond, some to buy and some to sell, then the market-maker should be willing to make a very tight price in the bond, only a few cents wide. But if the market maker doubted that any sellers or buyers would be seen for a day or so, then the price must be wider, to compensate the market-maker for holding the risk (of course the market maker can hedge in the same or a similar instrument, but at the price of paying somebody else’s bid-ask spread).
For a government it is easy to reduce the expected time between transactions: ensure that bonds are larger. Larger bonds have more numerous holders, who hold more of them and hence deal more. Larger bonds increase liquidity and reduce dealing costs.
But bonds must not be so large that, when they mature, there is pronounced payment lumpiness. Hence bonds should not be abnormally large at maturity. How large is abnormally large? UK gilts >£10bn have matured (e.g., £12¾bn 7% November 2001), and the 4% March 2009 is almost £17bn. But this £17bn is in March 2009 money. So the 4¼% December 2055 gilt could be, assuming 2% annual inflation for the intervening 46¾ years, almost £43bn, and at maturity still be the same size measured in loaves of bread or pints of beer. But even this isn’t quite fair: the real economy (and the government’s tax take) also grows. Conservatively let’s assume real growth of 2% per annum, in which case that 4¼% December 2055 could be over £100bn and still be a smaller proportion of tax revenues at maturity than the £17bn March 2009.
Because this lumpiness is measured as a proportion of tax revenues at maturity, and there will be inflation and real growth between now and then, long bonds can be very much larger than shorter bonds, and even larger relative to bonds that have already matured. (If there should be deflation or slow growth, governments could switch the bonds longer when there are ten years to maturity.) Hence large long bonds do not entail any over-concentration of payments.
Short dated bonds need to be well dispersed, with approximately even payments in each tax year.
Long-dated bonds should be large, and can be few.
In the light of this reasoning let’s review the recent actions of some of the prominent debt issuers.
This essay was motivated by the decision of the United Kingdom Debt Management Office to issue a new 4¼% December 2027 (auction announcement on 29 August 2006). There is no possible liability that could be hedged with this issue that could not be hedged with some combination of the £16bn 5% March 2025 and the £12bn 6% December 2028. This new security therefore pointlessly splits and diminishes the liquidity. If the government really wanted to borrow at 20 years†, it should have re-opened‡ the 6%28.
Indeed this is not the only redundant gilt to have been issued recently. On 11 May 2006 the DMO auctioned £2¼bn of a new 4¼% December 2046 (announcement). There is already a 32-year (£15bn 4¾% December 2038) and a 49-year (£11.6bn 4¼% December 2055). So what purpose can the 40-year have? As the right-hand swap charts demonstrate, a 40-year interest rate can be very accurately replicated with a 30- and a 50-year (let alone a 32- and a 49-year), so investors cannot be expected to overpay for it. Meanwhile the 2055 is relatively small and illiquid, and after another 49 years of 2% inflation its redemption will be equivalent to £4.4bn in today’s money (discounting at 2%) or the same proportion of the tax take as £1.7bn (assuming annual nominal growth of 4%). The 2055 can be ten times bigger without introducing excessive lumpiness into our children’s payment schedule, and if it were 4× to 6× bigger, foreign investors would own it for being the most liquid DV01.
Score sheet: The United Kingdom is better than other governments at re-opening bonds, but gilts are still too numerous and too small.
Recommendation: if issued before 2015, the next new post-15-year gilt should mature not before 2080 (and on 7th June or 7th December, to facilitate partial strippability). Until then keep re-opening the 4¼% December 2055, or at least until it is most of £100bn.
In November 2001 the United States announced the end of the 30-year auctions, a decision already criticised by this author. However, 30-year auctions have now resumed, and are improved. Between February 2026 and February 2031 there are twelve bonds with an original maturity of 30 years! What on earth for? What possible liability could have been hedgable with a 6⅝% February 2027 that could not have been hedged with the 6½% November 2026? But the new 30-year, the first for five years, the 4½% Feb 2036, was issued with $14bn, and in August 2006, when this security had 29½ years life remaining, was re-opened with another $10bn. Still, $24bn is a toy-town dinky size for the long bond of the world’s pre-eminent economic power: four ≥15-year gilts are bigger than this (5%25, 4Q32, 4Q36, and 4T38), and the UK’s 6%28 and the French 5¾% October 2032 have nominal sizes only slightly smaller.
How big can the 2036 be? The 3% November 2007 is $44bn, so this size must be acceptable. Assuming 2% inflation for the intervening 28½ years allows the 4½% Feb 2036 to be $77bn; and assuming nominal GDP growth (or growth in nominal tax revenues) to be 4.5% allows a size of $154bn.
Unfortunately the 4½% February 2036 is now as big as it will be. At the August 2006 refunding the Treasury announced that the February auction will be of a new 30-year, re-opened in May 2007 (good!), but that the August 2007 auction will be of a new 29¾-year maturing May 2037, to be re-opened in November.
Score sheet: when the author started in fixed-income markets the US and France were the most competent issuers of debt, by a good margin. In the intervening years the US ranking has slipped, though the auction-twice policy now started is an improvement.
Recommendation: re-open the May 2037 until it is at least $100bn, then create a 50-year and grow that to twice the size.
Japan’s first thirty-year was the 1.1% March 2033 issued in March 2003, since when there has been a new 30-year every quarter. These 30-year JGBs are tiny, having a size-weighted average size of ¥500bn ≈ $4bn. Contrast with the four JGBs maturing on 20 December 2007, with a total size exceeding ¥7 trillion ≈ $62bn. So even assuming 0% growth in nominal tax revenues over the next three decades, an acceptable size for a JGB should be ≥$62bn. But this number is bigger than the total size of the fourteen ‘30’-year JGBs.
Happily the situation is a little better at 20 years, in which the 2.3% June 2026 is $14bn. But this is still too small, and most other 20-year JGBs are about $7bn.
Score sheet: not good.
Recommendation: fewer please, and larger.
France and Germany are in a different position to the issuers mentioned so far, as they do not have sovereign power over their currency, and are not the only ‘government’ issuer in that currency.
In February 2005 Agence France Trésor issued a 4% April 2055 OAT, the longest-dated euro-zone government bond, that is now trading about 8bp expensive (1.7% of price) to a smooth forward model. Making the usual assumptions about inflation and real growth, this bond could be very much larger than its current size of €11.4bn. However, a euro-zone government should not want to issue too much long-dated debt. If there should be a deep deflationary recession, the credit of France might be imperilled, and she should want much of her debt to be short-dated — to be refinanced at lower interest rates (this is a side-effect of not having a true sovereign issuer in a currency: see previous comment on this subject).
But this reasoning does not explain the recent issue of a new OAT 4% October 2038. The previous 30-year, the 4¾% Aril 2035, is still very small at only €15.6bn, and could prudently be several times this size.
Germany’s last three 30-year Bunds are €17bn (5½% January 2031), €20bn (4¾% July 2034), and €23bn (4% Jan 2037). Though larger than the French 30s, these still fall short of the sizes suggested by compounded nominal tax growth.
Score sheet (France): not bad, though the long bonds could be several times the size. Commendation for being the first (so far, only) euro-zone government to issue a 50-year, though, again, it is too small to be liquid.
Score sheet (Germany): better on size, but no 50-year commendation here.
Recommendation (France): larger please; and don’t repeat the UK’s error of a 40-year. Whatever you might have sold in 40s, instead sell as re-openings of the 4% April 2055.
Recommendation (Germany): also larger please. France has beaten you to the 50-year: there would be much pension demand for an even longer bond. Issue a 60-year, and make it huge.
Julian D. A. Wiseman
New York, September 2006
† The United Kingdom should not be borrowing at 20 years at all. Much of the money in UK gilts is tracking a 15+ index, and so in late 2012 most investors will be selling the 4¼% December 2027 gilt, at which time it will cheapen by about 5bp relative to a smooth gilt curve. If the UK DMO were a hedge fund, intending to buy back the bond after it cheapened, that would be cunning, but the DMO did not buy back nor switch longer the 8% June 2021 when it fell from the index, so even that excuse appears to be lacking.
‡ Even for a re-opening of an existing gilt, the UK actually creates a new ‘WI’ security with its own ISIN, and has that new security merge with the old almost immediately after the auction. For the purposes of this essay, this is equivalent to re-opening the old security. But it is inadvisable: other debt managers should not do likewise. The only circumstance under which this new-security-and-merge process would be different to a true re-opening is if the auction were cancelled. But market participants treat trades in the WI as being equivalent to trades in the old security for settlement after the auction. Nobody manages this WI-versus-old risk. Nobody measures it. It seems that almost nobody thinks about it. So why has the DMO (and the BoE before it) left this submerged log lying about in harbour? At best, it is harmless. But it could be an accident waiting to be discovered at a time—cancelled auction—when the authorities will have more than enough else to do. Presumably the market makers will think about this risk when the Financial Services Authority asks them how they measure it, at which time they will ask the DMO to stop this needless complication. Please tell the author whose attention at the FSA could most usefully be drawn to this footnote.
June 2016: still too many bonds; still too small. Why, really, why oh why is there a 2½% 2065 gilt and a 3½% 2068 gilt? The former has longer duration; the latter has longer convexity÷duration: they have very similar risk characteristics, but split the liquidity. Please could the next new super-long gilt be very different from these two by being much much longer than 2068: perhaps 2080, perhaps ’85, perhaps even ’94. Or, even better, a two-century gilt maturing circa 2216.
But there has been one small victory: no more temporary WI security in gilts.
| Main index | Top | About author |